
International comparisons: WEF and PISA
It’s that time of year again – when the World Economic Forum publishes its annual assessment of progress towards gender equality. This is a treasure trove of data and comparative rankings on four dimensions of equality: education, health, politics and economics.
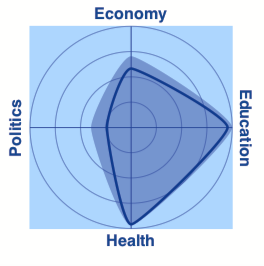
The headline news for the UK has been simple: the country went down 6 places in the overall ranking, dropping out of the top 20. I suppose you could take this as a timely signal of the slide into mediocrity – but I’m always one to avoid cynical pessimism. Here’s how the UK’s overall picture looks:
Let me get my methodological beef out of the way. On education, WEF reports that “education parity has been fully achieved in 40 of the 153 countries ranked”, and that the global parity index stands at 96.1%. Well and good – but because 100 is the maximum their approach allows (ie symmetry between males and females) this prevents them from showing how women are outdoing men educationally in so many countries. That right had arrow should be sticking out well beyond the outer circle – even though it would screw up the tidy image.
So no fewer than 35 countries are all ranked together at the maximum, and a further 50 countries are over 0.99 on the index. This disguises a lot of educational variation between these countries. More importantly, it makes the failure to make progress on the economic front all the more stark (this is, of course, the central point of the Paula Principle). And when we turn to Economic Participation and Opportunity the picture is very different:
“This is the only dimension where progress has regressed. Here, the figures are sobering, with a deteriorating situation forcing gender parity to a lowly 57.8%, which in time represents a massive 257 years before gender parity can be achieved.”
The EPO index uses three concepts:
- the participation gap: the difference between women and men in labour force participation rates
- the remuneration gap: ratio of estimated female-to-male earned income
- advancement: the ratio of women to men among legislators, senior officials and managers, and the ratio of women to men among technical and professional workers.
The report suggests three main reasons for this deterioration:
- women have greater representation in roles that are being automated;
- not enough women are entering professions where wage growth is the most pronounced (most obviously, but not exclusively, technology), and
- women face the perennial problem of insufficient care infrastructure and access to capital.
To which I would add: the failure to recognise and reward female competences and qualifications.
The UK’s score on the EPO index is .704. It is ranked at 58th, between Poland and Swaziland. On the different components of this index, the UK scores quite highly as you would expect on ‘participation’ ; we have lots of people in work, it’s just that they aren’t paid well. On wage equality the UK ranks 76th. And on the ‘advancement’ sub-index – which looks at how many women get to senior levels in professional life – it is 71st. These are not signs of a country at the forefront of progress, economically or socially.
The contrast between performance on the education and economic indicators is exactly why we need to focus on the dynamic relationship between the two What effect has greater equality on the one had on the other? The answer is, not nearly enough – and we should be asking why this is the case.
Let’s switch to another major source of international comparative information: PISA (Programme for International Student Assessment). This attracts massive coverage, largely because of its ranking system: there is always news in whether countries have gone up or down the list, overshadowing the more interesting issue of whether they have progressed or not in the actual scores.
I have to admit that I now see PISA as something of a Frankenstein. It was hugely useful in its early years in pushing countries to ask themselves (or be asked) awkward questions about how well their education systems are performing. Now, however, it has grown into a massive circus, with the positive potential for providing feedback on actual progress in substantive performance drowned out by the screeching on rankings. And the whole exercise absorbs massive resources which could arguably be better used elsewhere.
Be that as it way, the 2018 results were published recently. You can browse them at your leisure…I’ll make just two points.
First, and relevant to the WEF results, there is interesting data on 15 year olds’ expectations of the future. In the UK 28% of high-performing boys expected to be working in science and engineering professions when they were 30, compared with 20% of girls. That there is a gap is entirely predictable, but actually I found it surprisingly small at just under 8%; indeed it has to be said that it is well below the OECD average of 11.5% Conversely, 26% of high-performing girls but only 11% of boys expected to be working as health professionals. So occupational choice continues to be one of the reasons why progress on the WEF Economic index is so poor. But it is only one reason: I’ll continue to argue that it’s the way these choices are rewarded that we should be paying more attention to.
Overall, across all countries 15-year-old girls massively outperform boys in reading scores. Their respective mean scores are 502 and 472. (UK figures: 514/494, showing a smaller gap). This is very familiar territory. But it’s important to stress that at this stage performance on science is just about equal (490/488; UK figures 506/503). On maths there is a slight gap in favour of boys (487/492). Here the UK figures diverge a bit, with a wider gap (496/508), but this is not big – certainly not enough to account for subsequent occupational divergence.
One final piece of information. The OECD analysis shows gender gaps in student satisfaction with life – with the UK showing very nearly the biggest gap. The % difference between boys and girls saying they are satisfied with life is 17 in the UK. The OECD average is 11%; only in Slovenia and Korea is the gap bigger than the UK. That seems to me profoundly sad.
Sorry to be a bit of a misery guts just now. I’m off to read my Xmas present – a novel based on the life of George Eliot. What an inspiration she was, and is, for anyone interested in the fulfilment of talent.